Mixhers
Awarded
by utah valley businessq
UX Designer & Website Team Lead
July 2022 - Current ~2,100 hours

My design Process
While every design process varies slightly, I always work in the rhythm as shown in this diagram by Nielsen Norman Group. It allows for a variety of different pathways, while maintaining the six core parts of the design process.

Understanding the problem
When I was hired, Mixhers was approaching its 3rd birthday and needed help with UX design, project management for the web team, and website management. They brought me on to better identify problem spaces and execute a plan for improvement. Luckily, they already had a live site, which made collecting data surrounding our UX very easy. In order to more clearly identify where we could improve, I leveraged surveys, A/B tests, changes in analytics, as well as data from our subscription platform.
In getting a better understanding of our customer's pain points, the most helpful insights came from a post-purchase survey and our subscribers reasons for churning (cancelling their subscriptions to our products).


Key insights
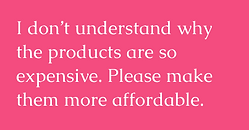
Another member of our team whose role is dedicated to gathering customer insights was able to use a third-party software to fully analyze our data from these surveys and pull out the strongest insights. By a landslide, the largest pain points for our current customers were:


Problem Statement
Our customers are really struggling to understand how our products would impact their bodies and the science behind them, therefore having a direct impact in their willingness to spend their money on our products. They desire better education on each of the products and our company as a whole, so that they can feel confidence in paying for a higher ticket item.
Defining our users
User personas
Based on extensive data gathered through a focus group and over 3 years of market research, we make all of our decisions at Mixhers with these personas in mind. This is integral to delivering what our customer's desire and creating a company and product that is focused on serving our customers first and foremost.


Customer journey Mapping

User flows prior to changes
Prior to reworking our user flow, it was important to gain a better understanding of user behaviors as things already stood, and try to use those to identify potential opportunities. Using Google Analytics we are able to see what the user flow is through our site at various points in time. With these charts (split by user device). Marked in pink, you can see where a huge portion of visitors were bouncing.


Ideation

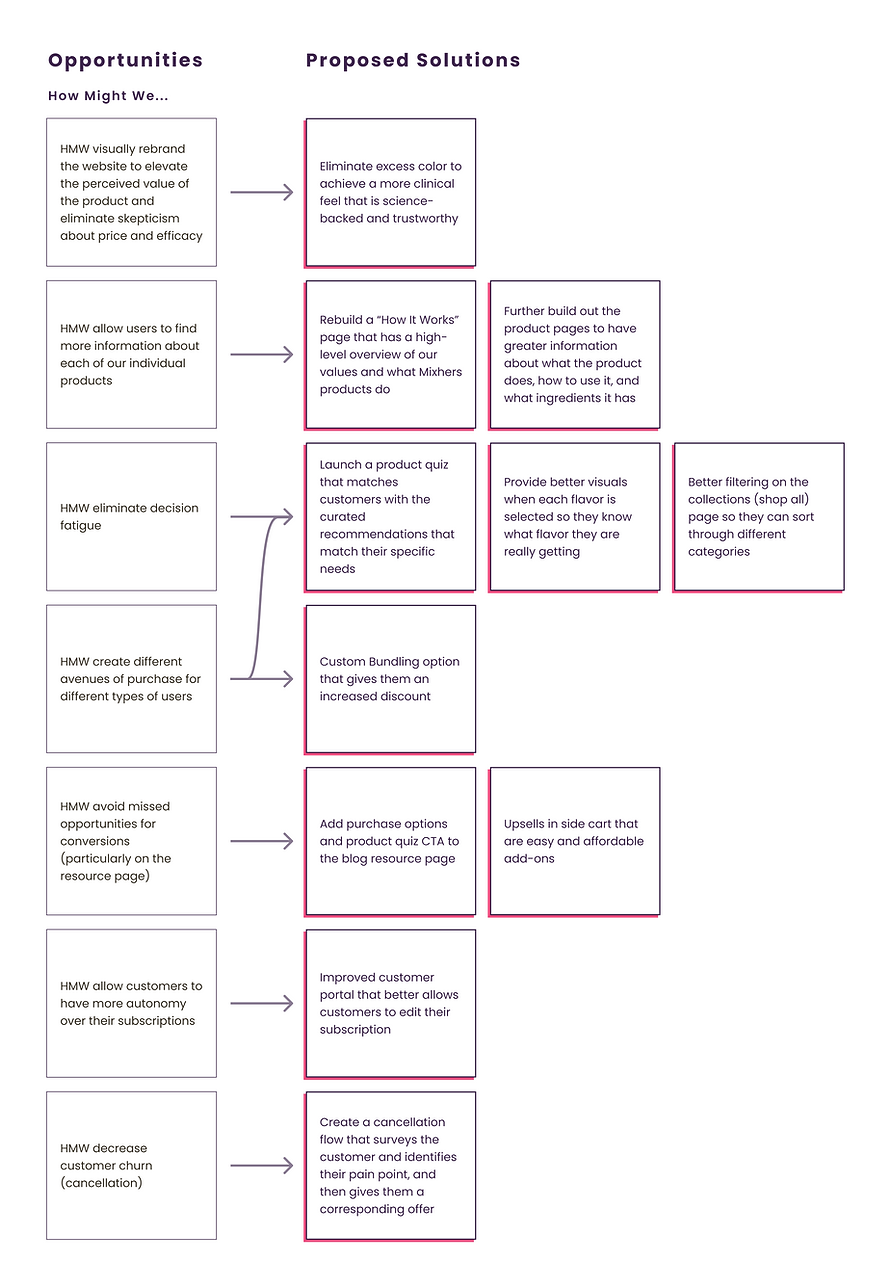
Gathering key stakeholders, we conducted some activities to dive deeper into proposed solutions, particularly pertaining to education. We posed a question and then voted on what we saw customer's were needing the most from us.

Designing
Mood Board
Our brand team created a brand mood board to work with, and I also created a high-level mood board that evoked what I was aiming for with the UI. We wanted to accomplish a soft, somewhat-brutalist UI with strong typography, clean imagery, and intentional use of color.


Improved User flow

Information ARchitecture

Sketching
Sketching was done mobile-first and then scaled as fidelity increased.

High-fidelity wireframes
Home


Shop all


Product page
How it works


Custom bundle


Product quiz


Articles
Side Cart


before & After Redesign
before & After Redesign
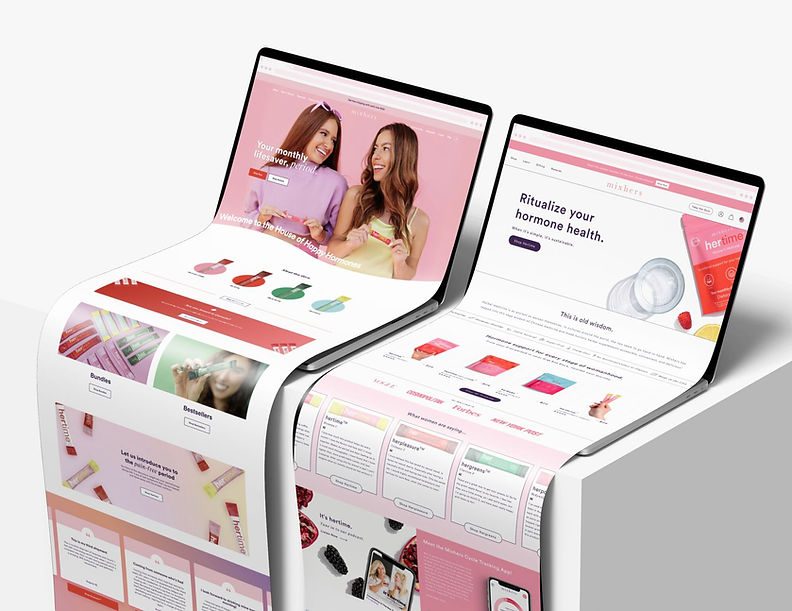
Before pictured left, after pictured right.


Testing (ongoing)
After rigorous QA testing, we launched our new pages using A/B testing through Google Optimize to gather data on whether or not the designs were accomplishing business goals, as well as closely tracking analytics on conversion rate, bounce rate, and customer retention.
In A/B tests, all of our pages performed better than their previous version, specifically in regards to conversion rate and total revenue.
Surrounding our product quiz, we have collected some really excited data. We are approaching $1 million in revenue from our quiz in just a few months of deployment. Our conversion rate is 2.25 times higher for those who take our quiz and the average order value is $26.36 higher than that of our average site visitors who don't participate in the quiz.
We continue to improve our website through agile processes and actively receive feedback from customer support in order to make necessary changes that improve the customer experience.
Learnings
Working at Mixhers has been a wildly different experience than any past position I have worked, and I believe it is due to the fact that the digital product my team is designing and building is not the actual product that we are selling. This means that our UX processes have to coexist with marketing campaigns, sales, product launches, and many other external factors. While this has made the UX processes a little bit more avant garde than at your usual tech company, it has taught me to operate very quickly and intentionally, and ultimately, that not every UX process is exactly the same–every company has it’s own ways of operating, goals, and ways of connecting with their customer’s, and therefore will have it’s own methods of tackling pain points and fulfilling user needs.
One of my favorite things has been that we are actively able to collect so much data on our customers through a live website, whether through analytics softwares, surveys, or customer support, that we can really quickly identify pain points & needs and deliver on those.


